This blog post was originally published at Intel's website. It is reprinted here with the permission of Intel.
The artificial intelligence (AI) revolution is having a profound impact on countless technologies. From automatic identification of our family and friends in social media to ordering up our next movie through voice commands, AI is everywhere. At Intel, we are dedicated to advancing AI across all domains, but we’re also working on research at the most fundamental levels to improve the world around us in groundbreaking ways. This blog post is about one such major research contribution.
Anomaly Detection
While many cloud providers and enterprises rely on Intel technologies to power computer vision, autonomous driving, and next-generation AI hardware, most may not realize we’re also working on advances that may reshape the entire field of AI. One such area is in our research in anomaly detection. Anomaly detection is the process of identifying abnormal events, also known as anomalies, using advanced detection techniques, such as deep neural networks (DNNs).
In our NeurIPS ’18 spotlight paper, “Precision and Recall for Time Series,” we take a fundamental look at the metrics used to evaluate anomaly detectors. These metrics are the tools that machine learning (ML) scientists and engineers everywhere use to measure the accuracy of their anomaly detection systems. What we present in our paper has the potential to change the way that these scientists and engineers perform anomaly detection evaluation and training. But before we can go into those details, we need to provide a bit of background.
Background
The field of anomaly detection has existed for over a century, yet most of the complex anomalies that exist today, such as zero-day cyber-attacks or multi-car intersection collisions, are generally undetectable (and therefore unavoidable) with state-of-the-art anomaly detection techniques. This is because the techniques that we’ve been using to evaluate and train such anomaly detectors are insufficient for complex time series anomalies. Unfortunately, we find that time series anomalies represent the majority of the anomalies that we see and care about today.
When scientists and engineers first began to formally assess search algorithms in the 1950s, two fundamental evaluation measurements emerged: precision and recall. Applied to classification problems such as anomaly detection, precision tells us the ratio of anomalous events that have been correctly identified compared to the non-anomalous events that have been incorrectly identified. Recall tells us the ratio of anomalous events that have been correctly identified compared to the anomalous events that have not been correctly identified. Mathematically, they are defined as follows, where TP are the true positives (the actual anomalies), FP are the false positives (mispredictions of anomalies that are not anomalies) and FN are false negatives (mispredictions of non-anomalies that are, in fact, anomalies):
Precision = TP / (TP + FP)
Recall = TP / (TP + FN)
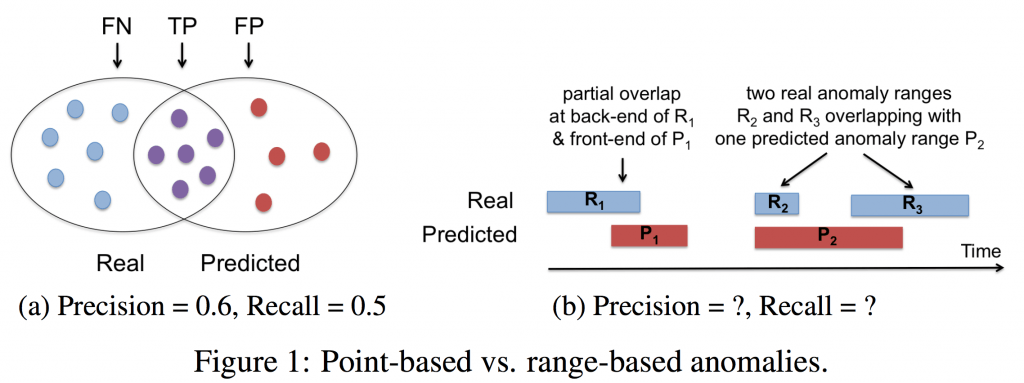
While precision and recall work well for simple anomalies that occur at a single point in time, also known as point-based anomalies, they aren’t sufficient for anomalies that occur over a period of time, also known as range-based anomalies. Yet, most of the complex anomalies that exist today, such as cybersecurity attacks, are range-based (or time series) in nature. Figure 1 demonstrates this visually. Figure 1(a) shows an example of a classical representation of real and predicted anomalous points. Figure 1(b) shows an example of real and predicted anomalies as they might occur in a time series setting.

Of particular importance is that time series anomalies raise new questions that cannot be answered using classical precision and recall. For example, how does one deal with partial overlap scenarios between a real and predicted anomaly range? How is a predicted anomaly evaluated when it encapsulates more than one real anomaly? Can a detection system be rewarded differently for early or late detection? Unfortunately, classical anomaly detection evaluation metrics cannot quantify such results. It’s because of this, that we realized anomaly detection metrics must evolve if we want them to properly measure the systems that attempt to identify complex time series anomalies.
The Problem and Our Approach
The task of detecting anomalies in ranges of time series data is complicated by many factors. One such factor is covered by ranges with overlaps. In the point-based case, a predicted anomaly point is either a member of the set of real anomalies or not. In the range-based case, a predicted anomaly range might partially overlap with a real one. In this case, a single prediction range is partially a TP and partially an FP at the same time (Figure 1b). Yet, classical anomaly detection metrics have no way to quantify this partial overlap scenario.
Further, we may need to consider the position of the overlap within the time series. Applications like real-time response or medical diagnoses may wish to provide a greater reward for early detection systems, so early action can be taken. On the other hand, applications triggering irreversible actions—such as robotic defense systems—may want to focus later in the time series to ensure they are acting on certainty. Our approach to detecting anomalies in time series provides scientists and engineers the knobs to tune their evaluation bias in whatever manner is needed for the domain being analyzed.
Given a set of real anomaly ranges and a set of predicted anomaly ranges as exemplified in Figure 1b, we have developed a new formulation that iterates over the set of all real anomaly ranges computing a Recall score for each range and adds them up into a total Recall score. This total score is then divided by the total number of real anomalies to obtain an average Recall score for the whole time series. Likewise, for range-based Precision, we iterate over the set of predicted anomaly ranges to compute a Precision score for each predicted anomaly range and then divide the total by the number of ranges to arrive at the average Precision score.
Our new formulation also provides the user with customizable parameters (e.g., positional bias) to match the specific needs of various domains. Example settings and guidelines can be found in both our paper and our associated source code.
Results
To test the utility of our new evaluation model, we applied it to a collection of diverse time series datasets and anomaly detection algorithms. Direct comparison with earlier approaches is difficult because our approach represents new capabilities that go far beyond what was previously available. However, when we tune our model to approximate the functionality of earlier models, results show that it successfully subsumes the classical precision/recall, and produces similar results as well as identifying additional intricacies missed by the Numenta scoring model. It also proves to be more general and flexible than either, indicating a higher potential for generalizability.
Future Applications
We’re continuing to extend the application of our work by developing machine learning techniques optimized for the new accuracy model now available for detecting anomalies in time series data. Even more exciting, we’re working with partners to apply our techniques in real-world applications, including an ongoing project to develop autonomous driving techniques. We believe this work from Intel is an important first step to reshape how we do time series classification in the broad range of emerging machine learning applications in industry, medicine, and other fields.
Learn More
We’re presenting a talk detailing our work and its results on Tuesday, December 4th at the Annual Conference on Neural Information Processing Systems (NeurIPS) in Montreal, where it was accepted as a spotlight paper. Our poster presentation will also take place that Tuesday at Poster Session B from 5 – 7 PM. If you won’t be at NeurIPS, you can download the complete paper for more details and watch our 3-minute teaser video. We have also developed a software tool that implements our new customizable evaluation model. It is publicly available as open source under https://github.com/IntelLabs/TSAD-Evaluator/.
Nesime Tatbul
Senior Research Scientist, Parallel Computing Lab, Intel
Justin Gottschlich
Lead Artificial Intelligence Researcher, Parallel Computing Lab, Intel